

Database monitoring is an invaluable tool when you need to react to a problem. And root cause analysis helped by monitoring can avoid repeat issues. That’s great, but we’d all rather prevent problems than react to them. Monitoring doesn’t provide the depth and level of information you need to predict and prepare for the future. MariaDB SkySQL Workload Analysis does.
MariaDB SkySQL Workload Analysis, currently in technical preview on SkySQL, ingests hundreds of metrics on your database, uses machine learning to build a model that characterizes your workloads, and lets you clearly see patterns over time so you can better understand past and present workloads, their challenges and extrapolate the future.
Unlike monitoring, MariaDB’s Workload Analysis tool:
- examines all available metrics and draws evidence-based conclusions
- leverages longer historical data, unlike monitoring, which typically retains data for less than a month
- is strategic rather than tactical
- is predictive and preventive rather than diagnostic and reactive
What’s in a Workload?
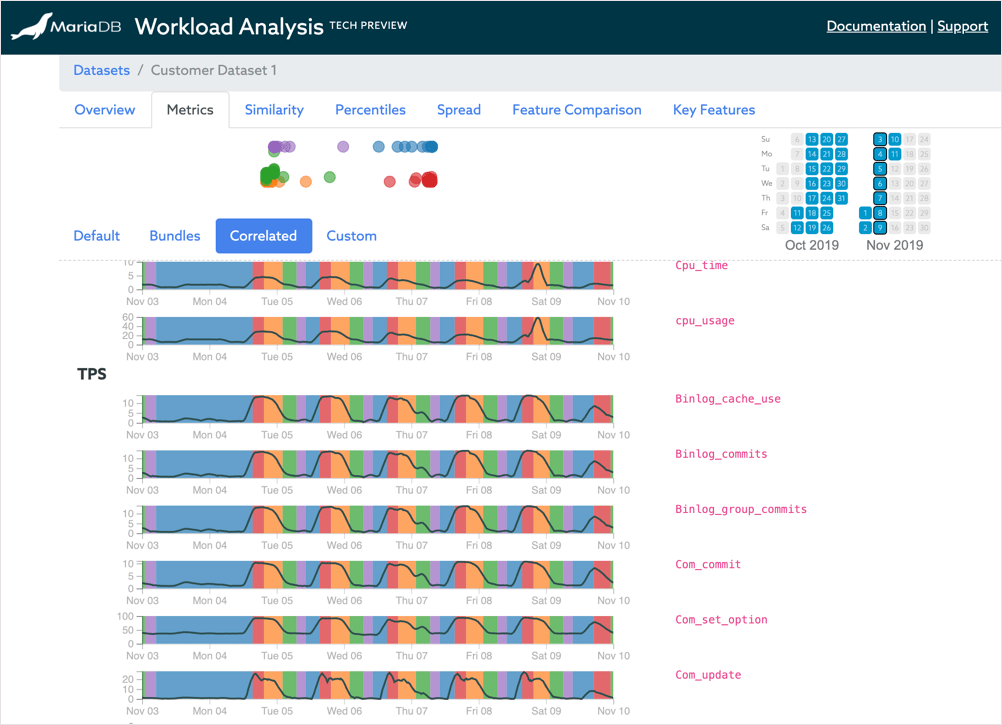
Workloads have generally been described with very broad brush terms like “write-intensive,” “read-intensive,” “mixed read/write” or even “analytical” or “transactional”. We’ve definitely done it ourselves here at MariaDB. But, anyone who has been around a database for any amount of time knows there is more granularity than that. Workloads change from hour to hour, day to day, week to week, even year to year, but it can be hard to pick out meaningful insights from the hundreds of metrics available. Enter MariaDB SkySQL’s Workload Analysis tool. With your permission, the Workload Analysis tool examines the many hundreds of metrics like CPU usage or innodb_rows_read or memory utilization that are available on your transactional database and identifies those that are most significant for describing your workload. This information is made available in a graphical representation alongside an interface that makes it very easy to examine the metrics of particular interest to you.Get Hands-on with Workload Analysis
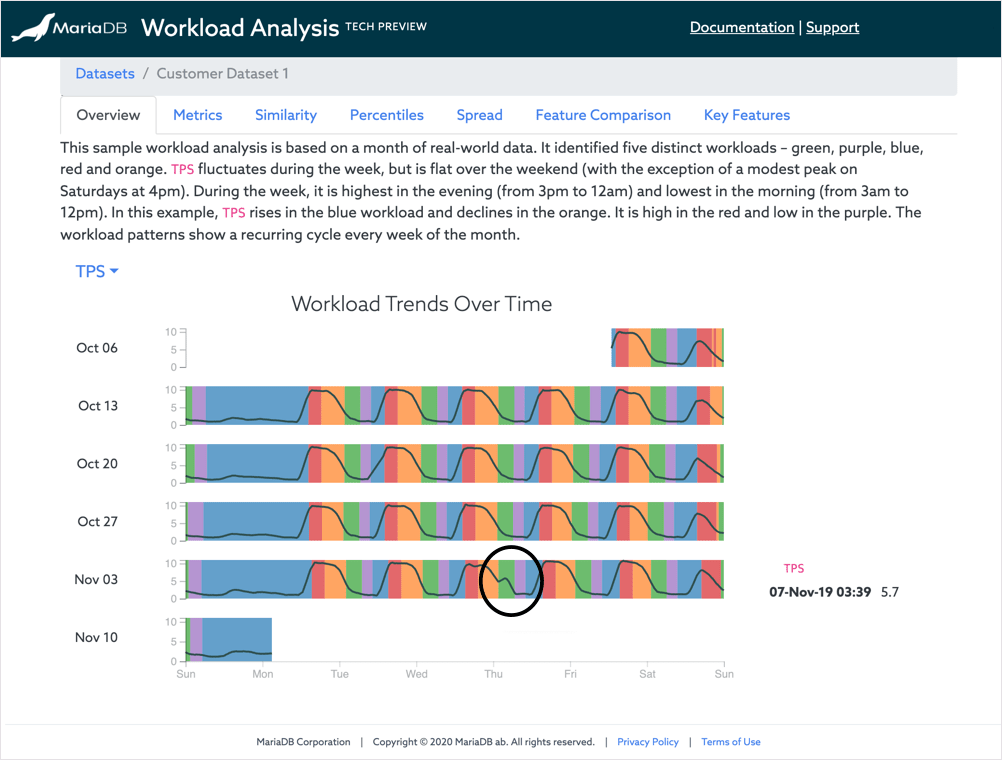
You can try the Workload Analysis tool right now on SkySQL. There’s a sample data set available to explore. If you choose to enable Workload Analysis, once your SkySQL database has run long enough to gather sufficient data (approximately two weeks), a model will be built. More valuable insights require more data. The sample data set is actual production data, so it can give you a good idea of what you can do with the tool.It is easy to spot the anomaly in Workload 2, week of Nov 03.
If you want this kind of information for your database, you can enable Workload Analysis on your SkySQL instance. The Workload Analysis tool is currently available for transactional databases on SkySQL.The Workload Analysis interface makes it easy to examine individual metrics.
