

Key takeaways
- 4x OLTP Throughput Improvement: MariaDB Enterprise Server 12.3 LTS delivers up to ~4x the throughput of MariaDB 10.6, reaching 2,653,370 NOPM in HammerDB TPROC-C benchmark testing.
- 56% Faster Than Release 11.8: Compared to 11.8.3-1's peak of 1,702,758 NOPM, version 12.3.3 achieves ~1.56x higher order throughput while utilizing 70% of CPU capacity.
- Lower Tail Latency: New Order p99 latency decreased by ~45% from 6.54 ms in 11.8.3-1 to 3.60 ms in 12.3.3 under high concurrency.
- Contention Reduction: Engine performance enhancements target internal latches, B-tree index locking, and buffer pool flush list mutexes to unlock scaling across high core-count hardware.
MariaDB Scaling Improvements From 10.6 to 12.3
Welcome back! For those of us at MariaDB, the 10.6 scaling story is familiar territory (the throughput curve that climbs nicely to ~88 threads and then flattens, no matter how many cores sit underneath it), and it has been the backdrop to more than a few customer conversations about why a bigger server did not buy a faster database. Compute is plenty, hence the question our customers are really asking is no longer whether the hardware is fast enough, but whether InnoDB can turn those cores into committed transactions.
This month, McKnight Consulting Group published a MariaDB-sponsored report that ran Enterprise Server 12.3.3 through a 768-warehouse HammerDB TPROC-C benchmark on a 192-vCPU Google Cloud instance. When we line those results up with Steve’s earlier run of the same 768-warehouse workload against MariaDB Enterprise Server 10.6.27 on a similar 96-core system (McKnight did not test 10.6, the long-term release a large share of our customers still run in production), the picture is hard to ignore. In the McKnight testing, 12.3.3 reaches 2,653,370 NOPM, ~1.56x the best 11.8.3-1 could manage (1,702,758) and ahead of the ~1.5x we were targeting for this release [1]. Compounded with the ~2.5x from 10.6 to 11.8 that Steve published last year [2], that is ~3.9x, or roughly 4x the throughput of 10.6. To keep the two data sets distinct, we cover the McKnight results first and then compare 12.3.3 with 10.6 in a separate section.
Enter MariaDB Enterprise Server 12.3 LTS (Long-Term Support).
We would argue this is the first release where the answer to “should we move off 10.6 or earlier versions?” can lead with throughput rather than features or support timelines, and in this post we walk through the numbers, the testbed, and the specific MDEV tickets behind them.
Note: this post picks up where Steve’s earlier piece left off, so for those who have not read it yet, we suggest starting with “Performance Engineered: MariaDB Enterprise Server 11.8 Accelerates OLTP Workloads by 2.5x” [2], which walks through the LSN allocation and redo log work (more on that later) that set up everything below.
Paying for Idle Cores
Let’s walk through a scenario that we expect will feel familiar to anyone who has sat in a customer capacity planning meeting. Alice is the lead DBA (Database Administrator) at Acme Supply, a wholesale distributor (fittingly, the exact kind of business the TPC-C benchmark models), and Bob is the CFO who signed off on a new 96-core (192 logical CPUs, with SMT on) server last spring.
Bob: “We doubled the cores. Why didn’t the order system get twice as fast?”
Alice: “Because the database spends a lot of its time waiting in line for itself.”
Think of a restaurant kitchen that hires 96 cooks but keeps a single ticket rail at the pass, where one person reads out every order. Adding cooks does nothing once the pass is the bottleneck, and past a certain point the extra cooks actually get in each other’s way, bumping elbows while they wait. Databases have their own versions of that ticket rail (internal locks that only one thread can hold at a time), and on a 96-core machine they become a big part of the story. The analogy has a limit, though: the database does not process transactions one at a time, and many run concurrently. The contention sits at specific internal points that many transactions briefly need, much of it around indexes, which are already partitioned so that work on separate partitions can proceed in parallel. Scaling is also more nuanced on chiplet-based processors like the one tested here, which Steve’s HammerDB article on scaling databases in the chiplet era [9] covers in more detail.
The numbers show exactly this pattern. On a 96-core system, MariaDB Enterprise Server 10.6.27 tops out at ~750,000 NOPM (New Orders Per Minute) at 88 virtual users, then drops to ~550,000 the moment the ladder steps up to 96 users, and never recovers. MariaDB Enterprise Server 11.8.3-1 does far better, peaking at 1,702,758 NOPM, however it also peaks at just 88 users and then declines steadily, with 60% of the CPU sitting idle at its best result [1]. In other words, Bob is paying for compute that Alice’s database cannot use.
A Quick Vocabulary
What does “waiting in line for itself” mean exactly? Before we dig into the results, let’s break down the handful of terms that carry the rest of this post.
- Latch / mutex: a short-lived internal lock (mutex = mutual exclusion) that protects a shared structure inside the database, such as the list of dirty pages or a B-tree index page, so that only one thread changes it at a time.
- Serialization point: any spot in the code where threads must pass through one at a time, which is our ticket rail from the kitchen above.
- Contention: what happens when many threads want the same latch at once, and the CPU burns cycles spinning or sleeping instead of doing useful work.
- TPROC-C: HammerDB’s open-source workload derived from TPC-C (the Transaction Processing Performance Council’s order-entry benchmark), which simulates a wholesale supplier taking orders, payments, and deliveries across warehouses. It is not an official TPC-C result [1].
- Virtual users (VUs): the number of simulated clients firing transactions back to back, with no thinking time, so 152 VUs means 152 transactions in flight at once [1].
- NOPM: New Orders Per Minute, HammerDB’s headline metric, counted from the database’s own tables rather than engine-specific counters, which makes it comparable across versions [1].
- p99 latency: the 99th-percentile response time (the slowest 1 in 100 transactions), which is the number customers actually feel on a bad day.
Remember: a database that scales well keeps adding NOPM as the virtual users climb. A database that hits a serialization point flattens out, and then often goes backwards.
The McKnight Results: 12.3 vs 11.8
Figure 1: Throughput by Virtual Users, MariaDB 12.3.3 vs MariaDB 11.8.3-1
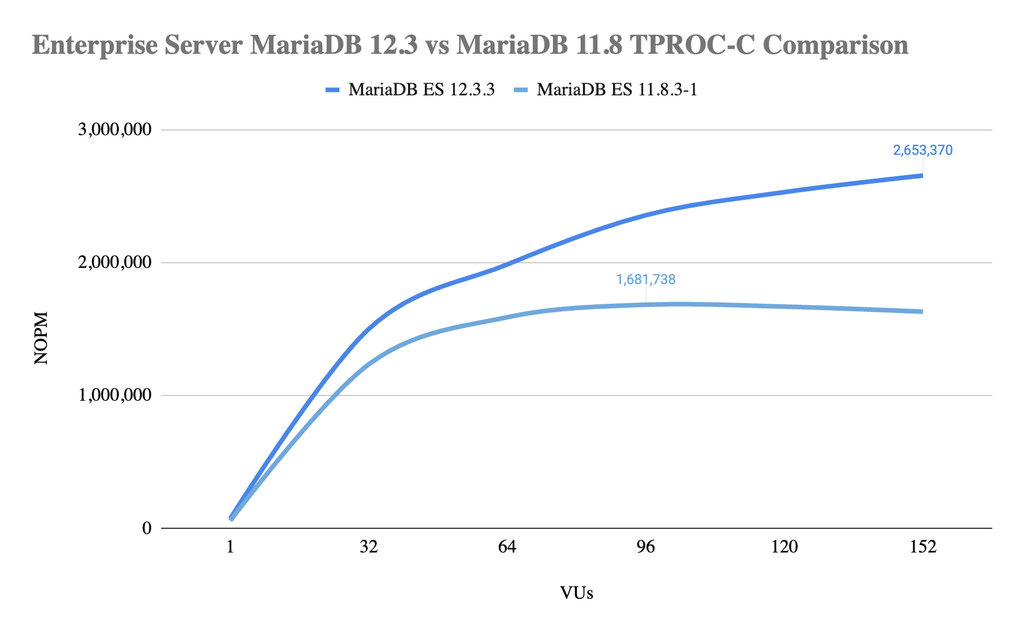
McKnight Consulting Group tested 11.8.3-1 and 12.3.3 on the same Google Cloud instance, with the same 768-warehouse dataset and the same ladder of 1 to 152 virtual users (see The McKnight Testbed below) [1]. Measured peak to peak, 11.8.3-1 reaches 1,702,758 NOPM at 88 virtual users and then declines, with 60% of the CPU sitting idle at its best result. 12.3.3 keeps climbing to 2,653,370 NOPM at 152 virtual users, ~1.56x the 11.8.3-1 peak [1].
The gains go beyond raw throughput. New Order p99 latency at each release’s best result is ~1.8x faster on 12.3.3 (3.60 ms versus 6.54 ms) even while it processes ~1.56x the orders, and 12.3.3 reaches its peak using 70% of the CPU [1]. Because both releases ran on the same instance at the same hourly cost, that is also ~1.56x the transactions per dollar [1].
Read the full benchmark by McKnight Consulting Group: High-Concurrency TPC-C Benchmarking: MariaDB Enterprise Server 12.3 vs MariaDB Enterprise Server 11.8.
How 12.3 Compares with 10.6
McKnight did not test 10.6. To show what the move from 10.6 looks like, we line the McKnight 12.3.3 results up against Steve’s earlier, separate run of the same 768-warehouse workload on MariaDB Enterprise Server 10.6.27, on a similar 96-core system [8]. Because the two runs used different environments, treat the comparisons in this section as indicative rather than like-for-like.
Figure 2: Throughput by Virtual Users, MariaDB 12.3.3 vs MariaDB 11.8.3-1 vs MariaDB 10.6.27
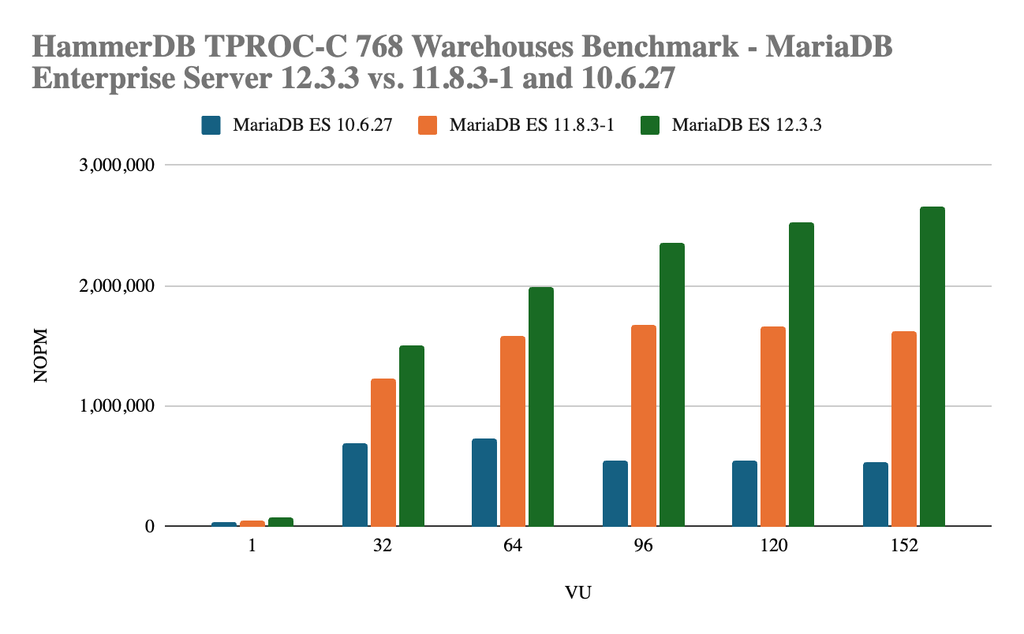
Figure 2: Throughput (NOPM) scaling across 1–152 virtual users for MariaDB ES 12.3.3 and 11.8.3-1 (McKnight [1]) and 10.6.27 (separate test [8]).
As you can see, the three bars tell three different stories. The 10.6.27 bars (blue) generally flatten by 32 users and fall sharply as contention sets in at 96, which, on a 96-core chip, is the point where the ladder passes one thread per physical core. The 11.8.3-1 bars (orange) climb much higher but roll over after 88 users. The 12.3.3 bars (green) keep climbing all the way to 152 users.
Figure 3: Throughput Advantage by Virtual Users, MariaDB ES 12.3.3 vs MariaDB ES 10.6.27
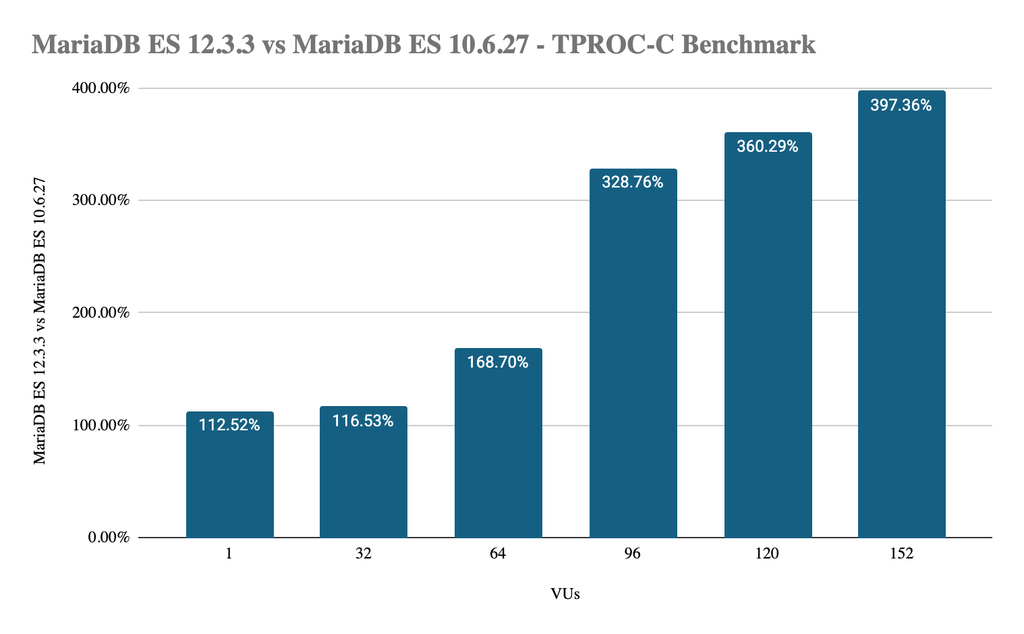
Figure 3: Percentage throughput advantage of MariaDB ES 12.3.3 over MariaDB ES 10.6.27 at each virtual-user level.
At 96 users, 12.3.3 is 328.76% faster than 10.6.27, and at 152 users it delivers ~4x the throughput (+397.36%), which enables significantly more throughput on comparable hardware. Even with a single virtual user, 12.3.3 more than doubles 10.6.27 (+112.52%), which hints that some of the gains come from a leaner code path per transaction, not only from better scaling.
The McKnight Testbed
All of the 12.3.3 and 11.8.3-1 testing ran, one database at a time, on a single top-tier Google Cloud instance [1], while the 10.6.27 baseline comes from Steve’s earlier comparison on a similar 96-core system [8]:
| Component | Specification |
|---|---|
| Cloud / zone | Google Cloud, us-east1-b |
| Instance | c4d-highmem-192-lssd |
| Processor | AMD EPYC 9B45 (Turin), 1 socket, 96 cores, SMT on (192 vCPU), 384 MiB L3 |
| Memory | 1,487 GiB |
| Storage | 16 × 375 GB Local SSD, mdadm RAID 0, ~5.9 TB |
| Operating system | Ubuntu 24.04.5 LTS |
| Workload | HammerDB 6.0 TPROC-C, 768 warehouses (~75–80 GB of data) |
The test procedure is worth understanding before quoting any of the numbers above, so let’s walk through it:
- Each rung of the ladder reported here (1, 16, 32, 64, 88, 96, 120, 152 virtual users) ran a 2-minute ramp-up followed by a 5-minute timed run [1].
- HammerDB ran on the same instance over a local Unix socket, using stored procedures, with keying and thinking time disabled, so the database itself was the only thing being measured [1].
- The configuration was deliberately in-memory and non-durable.
- MariaDB ran with its thread pool sized to 192 (one thread group per vCPU), and 12.3.3 ran with innodb_index_shrink = OFF, a non-default setting (more on that below) [1].
Continuous Performance Engineering
So where do the gains actually come from? Remember the redo log work from 11.8, where MDEV-21923 removed the mutex protecting LSN (Log Sequence Number) allocation and eliminated one of the last serialization points in redo logging [2]. Removing one ticket rail tends to expose the next one, and much of the 12.3 work reads like a methodical walk down that list, most of it grouped under an InnoDB epic titled “InnoDB Performance Optimization and Contention Reduction” and driven by HammerDB TPROC-C testing at high virtual-user counts [3][4].
The table below lists a selection of those tickets from the public MariaDB Jira tracker. As with the 11.8 release, anyone can open them, read the discussion, and see exactly what changed and why.
| Ticket | Summary | What the change does |
| MDEV-38814 | High rate of index lock upgrades during TPROC-C updates | Adds innodb_index_shrink; setting it OFF favors page splits over shrinking the B-tree on record-growing updates, cutting index latch upgrades, trading slightly sparser pages for far less index latch contention. Defaults to ON; the McKnight run set it to OFF [3] |
| MDEV-39600 | buf_flush_ahead() contention on buf_pool.flush_list_mutex | Replaces a mutex-guarded wake-up of the page flusher with a lock-free compare-and-swap, so only one thread signals, rather than every thread queuing on the same mutex to deliver the same message (picture 150 diners walking to the kitchen door to say the sink is full, when one would do) [4] |
| MDEV-40129 | Lock release attempts may fail due to transients | Retries a lock release briefly before escalating to the exclusive lock_sys.latch, accepting a slightly worse worst case for a much better common case [5] |
| MDEV-40427 | Redundant early-exit check in lock_move_reorganize_page() | Skips a check that only pays off on CPUs with lock elision (hardware support for running through a lock speculatively) [6] |
| MDEV-39490 | Optimizer trace start-up overhead in TPROC-C | Inlines the fast path when optimizer trace is off (the default), so the disabled trace no longer costs a function call on every statement, a good example of how relieving one bottleneck exposes the next [7] |
What It Means for Enterprises On-Prem and in the Cloud
Let’s go back to Acme Supply. Alice runs a proof of concept on the same 96-core server, and the conversation with Bob goes differently this time.
Alice: “At our peak-hour concurrency of ~120 sessions, 10.6 was handling ~550,000 new orders a minute. On 12.3, the same box handles over 2.5 million.”
Bob: “So we don’t need the second server in next year’s budget?”
Alice: “Not for throughput. And the slowest orders got faster, too.”
Those numbers map directly to the benchmark. At 120 virtual users, 12.3.3 delivers 2,528,641 NOPM [1], which is 360.29% above 10.6.27. Compared with 11.8.3-1, New Order p99 latency at each release’s best result falls from 6.54 ms to 3.60 ms (~45% lower) even while processing 56% more orders, and 12.3.3 reaches that peak using 70% of the CPU, versus an 11.8.3-1 peak that left 60% of the CPU idle [1]. Because every run used the same instance at the same hourly cost, the throughput gain is also a price-performance gain, with 56% more transactions per dollar than 11.8.3-1 [1] — a win-win for both Alice’s on-call rotation and Bob’s budget. In the cloud, where spend tracks vCPU count, that matters even more: because MariaDB Cloud runs on MariaDB Enterprise Server, the extra throughput per vCPU means the same workload can run on fewer vCPUs.
In addition to the above, a few places where this kind of scaling could matter beyond a single order-entry system:
- Teams consolidating several smaller database servers onto one large many-core instance can now expect the database, rather than lock contention, to decide how far that consolidation goes.
- Retail and e-commerce platforms that face seasonal peaks may be able to absorb a holiday surge on existing hardware instead of over-provisioning for a few weeks a year.
- Applications that put AI agents in front of transactional data [1] are likely to drive more concurrent sessions, which is exactly the high-VU region where 12.3.3 pulls furthest ahead.
- Organizations still on 10.6 that have been sizing hardware around its ~88-user ceiling may find they have been buying cores they could not use.
Current State and Final Thoughts
MariaDB Enterprise Server 12.3.3 is, by a wide margin, the best-scaling release of MariaDB we have seen, and it turns 10.6’s ~88-user ceiling into a curve that keeps climbing to 152. We are continuing to make significant investments in MariaDB Server performance, and our current thinking is that the release-over-release gains shown above may well keep coming, since every serialization point removed tends to reveal the next one worth working on.
Please let us know if you have any questions or have thoughts on the above. We look forward to discussing!

